When and Where Matter in Understanding Violence in Baltimore
If you been paying attention, Baltimore has been in the grip of an epidemic of violence going on two-plus years now. If you look closely at the crime statistics, you’ll see that there was an increase in the rate of homicides per day starting around March or April of 2015. The riots/uprising/call-it-what-you-will that happened at the end of April were, in my opinion, a mere symptom of a larger problem.
More on that larger problem later, in a different post.
One of the things that can be confusing about how crime statistics are presented is our respect for calendar years. For example, Baltimore’s 200th homicide of 2017 happened last week. This is how the Baltimore Sun reported it:
“A young man lay dead under a white sheet on Greenmount Avenue Wednesday afternoon, his sneakers poking out as police took pictures of the crime scene and logged the shell casings that surrounded him.
The stark scene, a fatal shooting committed in broad daylight in a violent corridor, pushed Baltimore to 200 homicides for the year.
…
The 200-homicide mark was reached far earlier this year than in previous years. Last year, Baltimore hit 200 homicides on Sept. 2. The year before, it reached 200 on Aug. 10. In prior years it reached the milestone in the winter. In 2011, there were fewer than 200 homicides for the year.”
The problem with looking at these numbers and laying over them the calendar year is that this makes the reader assume or think that there is some sort of reset button at the end of the year, the month, or the week. In fact, this 200th homicide for Baltimore (Donnell Pierce, age 23) is the nth homicide of the ongoing outbreak. The numbers didn’t stop and reset at midnight on New Year’s Eve.
Look at this graph:
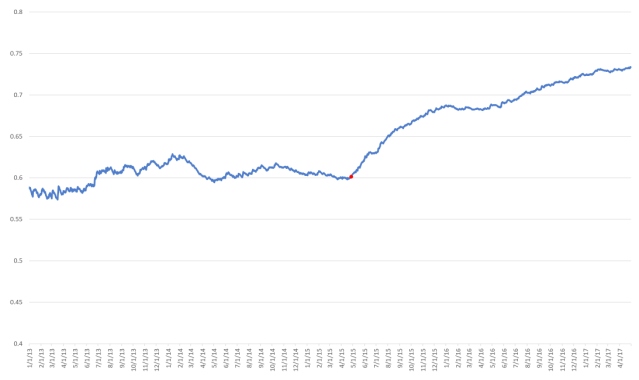
On the X-axis is date (from January 1, 2013 to April 30, 2017) and on the Y-axis is the homicides per day (from 0.4 to 0.8). The homicides per day was calculated starting in 2012, but it’s hard to graph the 0 and infinite values when the day is 1 and the number is 0 on January 1, 2012. As you can see, there is a increase and decrease on the rate of homicides per day throughout 2013 and 2014. Then, in 2015, there is a sharp increase in the rate of homicides per day. The red dot indicates the day in April of 2015 when the riots happened.
What does this tell us?
This tells us that the increased patrols, public outcry, and promises to fix all this should have started in mid-2015 when that upward trend in homicides per day started and didn’t come back down as it had in previous years. Maybe by October 2015 the authorities could have implemented something. Or, rather, they did, but here we are into the second year of the epidemic and there are still concerns and confusion on who is doing what.
I’ve noticed that they, the authorities, do this only when certain numbers are seen… 100 for the year, 200 for the year… But we’re pushing over 700 homicides since May 1 of 2015. When January comes around, the phrase “X homicides for the year” makes it seem like everything reset, like everything is normal. If a January is extremely cold, and there are few homicides, you’ll see the authorities claiming that their program(s) is(are) a success. Then they get the rude awakening that the epidemic continues apace.
One more thing.
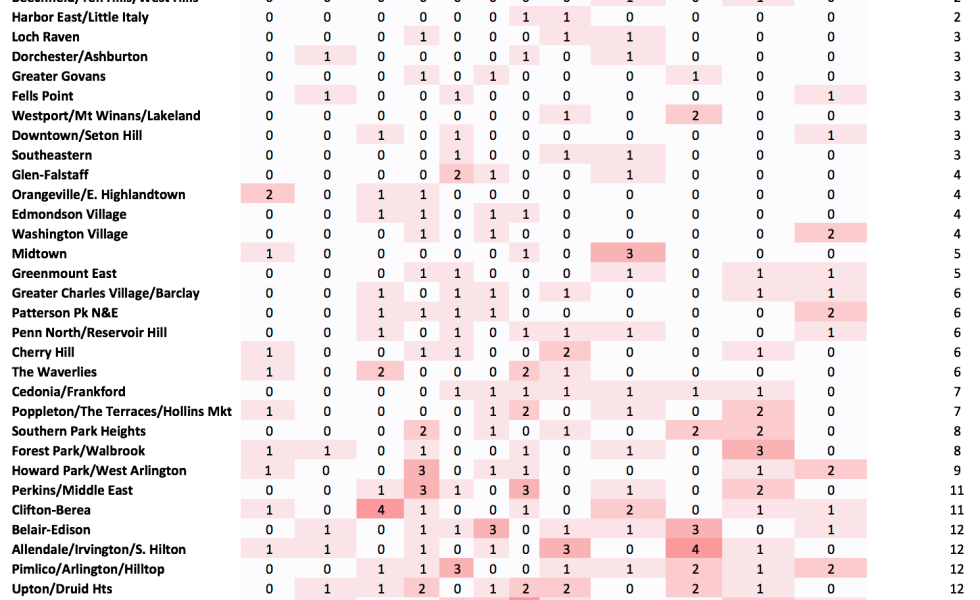
I was looking at the 55 Baltimore Community Statistical Areas (CSAs, areas made up of US Census tracts within Baltimore City) and when the homicides in 2016 happened. Here’s the heatmap of what I found using Baltimore’s Open Data site:
I sorted the CSAs by the total number of homicides and included only the homicides resulting from events in that year. (One homicide was the result of an event in a previous year.) As you can see, most of the homicides in Baltimore cluster around the milder/hotter months of the year, with January to March being the months with the least number of homicides.
However, when we look at the individual CSAs (aka “neighborhoods”), we find that different CSAs have different peaks. Look at Greater Rosemont, for example. It saw six homicides in February, then nothing in March, one in April, two in May, then nothing over the summer. There was not a homicide there again until October, then three in November, and one in December. Greater Rosemont certainly bucked the trend of the rest of the city.
Then there is Midway/Coldstream. That CSA saw four homicides in February, none in March, then one or two throughout the summer and the rest of the year. And then there are the CSAs that follow the rest of the city’s trend, or even define it, like Sandtown-Winchester/Harlem Park (where the riots started in 2015), or Southwest Baltimore.
So it’s not just about when these homicides occur. There is a strong geographic component to them as well. I’ll be looking at those associations later and across more time than just 2016. I wonder what I’ll find out?
In the meantime, I hope that authorities in Baltimore City are taking a good look at the way that they’re analyzing the epidemic. Things don’t reset at a point in time because the calendar says so. The epidemic continues since mid-2015, and it has not shown signs of stopping. In January, when the count for the year resets to zero, the count for the epidemic will continue. That is something that everyone, the governed and those who govern, need to be very aware of.
