Don’t Get Rid of Your Outliers Just Because
I was tutoring a student last week on how to conduct the analysis of some data they’re using for their final project. Their project is all about analysing a health intervention in women at risk for gestational diabetes. The measurement of the success of the intervention was the number of women who had gestational diabetes and the birth weight of the children born to all the women at the place where the intervention was done.
We were doing well in the planning for the analysis until the student mentioned something very interesting… They had gotten rid of all their outliers when it came to birth weight. “You what?” I asked.
“I looked for all the outliers in the birth weight data and got rid of them.”
“How did you do that?”
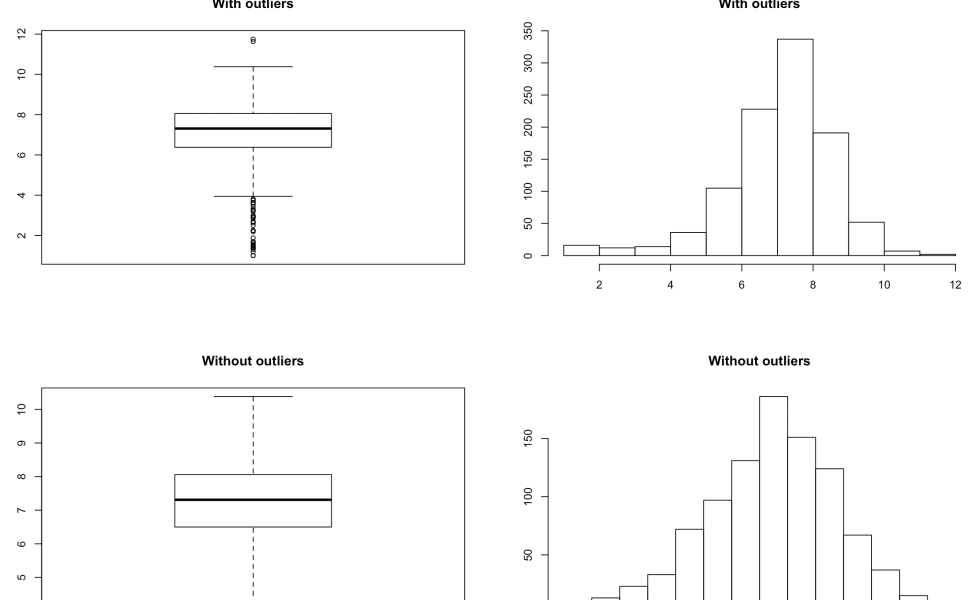
“I made a box plot and just got rid of all the outliers.”
If you’re wondering why this concerned me so much, it’s because women who experience gestational diabetes are at higher risk of having a large (>9 lbs) baby. In the student’s data, the number and proportion of women with gestational diabetes at a clinic did change from before the program to after, and so had the average weight of babies born. There were still some women who had gestational diabetes, and there were still some macrosomatic babies.
“Tell me, if high birth weight is one of your indicators, why did you get rid of the very high birth weights?” I asked the student. It was then that a lightbulb went off in their head.
“Oh… I shouldn’t have.”
“No,” I replied, “because you’re biasing your results.”
What made things worse is that the student had done their analysis on Excel, without keeping notes on what they had done. As a result, they didn’t know which records they deleted. To figure that out and undo it, they had to go back to the original dataset and compare it to what they had already, or just start all over. “I can’t start all over,” they said. “I don’t have the time. This is due in two weeks.”
Oh, boy.
One of the advantages of a statistics package like R, STATA or SAS is that your original data remains intact in the background while you play around with it. You also keep track of what you’re doing by writing a “program” that you can go back to and edit as necessary. It’s like writing a story for your data as you bring it from pure raw data form to something you are analyzing, to the tables and graphs you’re going to publish.
Yes, Excel does some great graphs, and it’s easy to build them, but you lose track of what you’re doing if you just point and click. It’s better to have a running record of what you’re doing. So, for the sake of your research, keep accurate notes if you’re going to use something that is not based on a program written by you.
One More Thing
One thing that I can’t figure out is whether or not someone told this student what would happen if they deleted outliers without thinking about it. Just one poorly deleted outlier can change the entire nature of the association between the dependent variable and the independent variable(s). You can’t just see a variable that is an outlier and delete it, especially if it is a variable that is associated so strongly with your outcome.
This leads me to believe that one of two things happened. Either the student was never taught this aspect of data analysis and interpretation, or they outright refused to do it… Or they were not paying attention. At any rate, someone other than an online tutor needs to be paying close attention. It doesn’t serve the student to let them go so far astray.

I had to remove all data points that disagreed with my theory in order to have results confirm my theory. That means, my theory is wrong. 😉
On a more serious note, outliers can at times, reveal something much, much deeper and hence, can lead to greater results.
One example may be, one group of outliers all have commonalities with those with intractable gestational diabetes, but have lower than normal or normal birth weights. What commonalities do the outliers of that group share, which just mitigate against gestational diabetic macrosomatic conditions?
Or in the case of a black hole merger, inspiral is observed, the peak of merger is observed, outlier data might be during ringdown, the ringdown has modulation, suggesting information from below the event horizon, such as a third merged singularity.
LikeLike
Don’t get me started on physics, especially astrophysics.
LikeLike
Don’t get me started on relativistic effects.
We’re now talking about four dimensional warping of the math…
LikeLike
One of my bosses at the Maryland Dept. of Health said his daughter was an astrophysicist. He said she had moved on from numbers to symbols and Greek letters. I wouldn’t even know where to begin.
LikeLike
I’ve looked at some fiendish equations in my time, in one, a full dozen functions, performing a quantum mechanical treatment of classical phenomena. I simply thanked our wise folk, who invented electronic computers.
I’d have taken a month of Sundays working that out with a slide rule.
Yeah, I can still work a slide rule.
LikeLike