Epi 101: Direct Age Adjustment by Hand and With R
When you’re comparing two populations’ death rates, you need to take into account the differences in the age distributions of the two populations. For example, if one population has more young people in it, you might not see as many deaths from heart conditions as you would see in a population with more adults over the age of 50. It’s not that the two are really different in the rates of death from heart conditions, it’s just that the population differences are accounting for this.
For Example
Let’s say you are comparing deaths from cancer in two populations, A and B, and you know that the particular cancer you’re looking at hits a lot of people over the age of 75, but only a few under the age of 15. The other age groups are affected somewhere in the middle. Let’s look at the data:
| Age Group | Population A | Number of Deaths |
| 0-15 | 10,000 | 100 |
| 15-35 | 12,000 | 600 |
| 36-55 | 15,000 | 1,050 |
| 56-75 | 25,000 | 2,500 |
| Over 75 | 30,000 | 4,500 |
| Total | 92,000 | 8,750 |
| Crude Death Rate: | 8,750/92,000 = 95 per 1,000 |
| Age Group | Population B | Number of Deaths |
| 0-15 | 25,000 | 250 |
| 15-35 | 15,000 | 750 |
| 36-55 | 20,000 | 1,400 |
| 56-75 | 12,000 | 1,200 |
| Over 75 | 11,000 | 1,650 |
| Total | 83,000 | 5,250 |
| Crude Death Rate: | 5,250/83,000 = 63 per 1,000 |
So population A has a death rate of 95 deaths per 1,000 residents. Population B has a death rate of 63 deaths per 1,000 residents. Clearly, if you want to stay away from dying from this kind of cancer, you need to go to population B, right? Well…
Look Closer
If you pay close attention, you will notice that the population distributions between the two are different. Population A has most of its residents in the 65-75 and Over 75 age groups. Population B, on the other hand, has most of its residents in the 0-15 and 36-55 age groups. That is, population B is a bit younger. So could it be that they have a lower crude death rate because they’re younger?
Let’s Find Out!
To compare the two populations, we need to use a standard population. A quick way to get a standard population is to use either population A or population B as a standard. Another way is to use the United States’ population distribution as a standard. Whatever you choose, you have to then compare the two populations’ age-specific death rates to that standard. For this example, I created a standard population:
| Age Group | Population – Standard |
| 0-15 | 20,000 |
| 16-35 | 30,000 |
| 36-55 | 35,000 |
| 56-75 | 37,000 |
| Over 75 | 28,000 |
| Total | 150,000 |
To this standard population, we are going to apply the age-specific death rates from each population, and use that to calculate the expected number of deaths in the standard population if the age-specific death rates for population A (and then B) are applied to the standard population.
| Age Group | Population Standard | Age-specific death rate Population A | Expected Deaths Population A |
| 0-15 | 20,000 | 10 per 1,000 (0.01) | 200 |
| 16-35 | 30,000 | 50 per 1,000 (0.05) | 1,500 |
| 36-55 | 35,000 | 70 per 1,000 (0.07) | 2,450 |
| 56-75 | 37,000 | 100 per 1,000 (0.10) | 3,700 |
| Over 75 | 28,000 | 150 per 1,000 (0.15) | 4,200 |
| Total | 150,000 | Total Expected Deaths | 12,050 |
Now, let’s do it for population B (and see if you notice a pattern):
| Age Group | Population Standard | Age-specific death rate Population B | Expected Deaths Population B |
| 0-15 | 20,000 | 10 per 1,000 (0.01) | 200 |
| 16-35 | 30,000 | 50 per 1,000 (0.05) | 1,500 |
| 36-55 | 35,000 | 70 per 1,000 (0.07) | 2,450 |
| 56-75 | 37,000 | 100 per 1,000 (0.10) | 3,700 |
| Over 75 | 28,000 | 150 per 1,000 (0.15) | 4,200 |
| Total | 150,000 | Total Expected Deaths | 12,050 |
Do you see it? The age-specific death rates for the two populations are exactly the same. You just got different totals in the crude rates because of the different age distributions. Once we applied the age-specific death rates to the standard population (aka “reference population”), we get the same number of expected deaths: 12,050.
With that, we get the same adjusted death rates for the two populations: 12,050 divided by 150,000, which is 0.080 or 80 per 1,000 residents. From this, you can conclude that the observed differences in the crude deaths rates is more a function of different age distributions between the populations than from actual differences in death rates between the two populations.
What About R?
To do this in R, we are going to need three packages: “dsr”, “epitools” and “knitr”. So pop open a new R script in R Studio and type:
library(knitr)
library(dsr)
library(epitools)
Next, we are going to create our data:
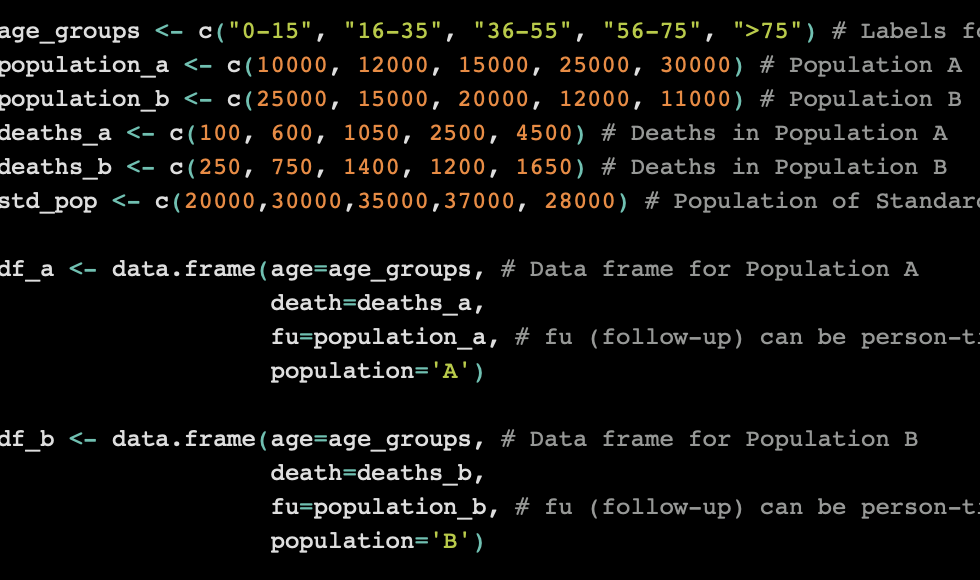
age_groups <- c("0-15", "16-35", "36-55", "56-75", ">75") # Labels for Age Groups
population_a <- c(10000, 12000, 15000, 25000, 30000) # Population A
population_b <- c(25000, 15000, 20000, 12000, 11000) # Population B
deaths_a <- c(100, 600, 1050, 2500, 4500) # Deaths in Population A
deaths_b <- c(250, 750, 1400, 1200, 1650) # Deaths in Population B
std_pop <- c(20000,30000,35000,37000, 28000) # Population of Standard Population
Note that we basically created six vectors to represent the data in the tables above. From these vectors, we are going to make some data frames.
df_a <- data.frame(age=age_groups, # Data frame for Population A
                   death=deaths_a,
                   fu=population_a, # fu (follow-up) can be person-time or population counts
                   population='A')

df_b <- data.frame(age=age_groups, # Data frame for Population B
                   death=deaths_b,
                   fu=population_b, # fu (follow-up) can be person-time or population counts
                   population='B')

df_all <- rbind(df_a, df_b) # Data frame combining both populations

df_pop <- data.frame(age=age_groups, # Data frame for the Standard/Reference Population
                     pop=std_pop)
With our main data frame “df_all” we can now use “dsr” to do the hard work for us, and we are going to store the results in “my_results” so we can look at them later.
my_results <- dsr(data=df_all, # What data frame are you using for your data
                  event=death, # The count of the events, in this case, deaths
                  fu=fu, # The follow-up time or, in this case, population counts
                  subgroup=population, # The subgroups "population" and "age"
                  age,                 # "population" meaning A and B, and "age" meaning the age groups
                  refdata=df_pop, # The reference data frame
                  method="gamma", # The method for the confidence interval
                  sig=0.95, # The level of confidence for the 95% confidence interval
                  mp=1000, # The rate multiplier is "per 1,000" in this case
                  decimals=0) # The number of decimals for your results
Now that we have the results in “my_results”, let’s look at them in a table:
knitr::kable(my_results)| Subgroup | Numerator | Denominator | Crude Rate (per 1000) | 95% LCL (Crude) | 95% UCL (Crude) | Std Rate (per 1000) | 95% LCL (Crude) | 95% UCL (Crude) |
| A | 8750 | 92000 | 95 | 93 | 97 | 80 | 79 | 82 |
| B | 5250 | 83000 | 63 | 62 | 65 | 80 | 79 | 83 |
Voila! You have the same results as you did doing it by hand, above. Congrats.
Of course, you can also use “epitools” to calculate these adjusted rates:
pop_a_adjust <- ageadjust.direct(deaths_a, # The vector of values for deaths for Pop A
                                 population_a, # The population of Pop A
                                 rate = NULL, # If you had a standard rate, you'd put it here
                                 std_pop, # Your standard/reference population
                                 conf.level = 0.95) # The confidence level for the 95% confidence interval
round(10^3*pop_a_adjust,0) # Look at the results

pop_b_adjust <- ageadjust.direct(deaths_b,
                                 population_b,
                                 rate = NULL,
                                 std_pop,
                                 conf.level = 0.95)
round(10^3*pop_b_adjust,0)
From this, you don’t get a fancy table (though you could make it one with some extra coding. You get an output, for Population A:
crude.rate   adj.rate        lci        uci
        95         80         79         82
And for Population B:
crude.rate   adj.rate        lci        uci
        63         80         78         83
And there you have it. Two ways to do this in R. You can now save the R file (or download the file I used by clicking here). If you have a lot of data, and you don’t want to write out the individual vectors at the beginning, then I suggest you learn the basics of importing data into R and then use that with the packages mentioned above.
Big thanks to these folks and these folks for their examples on how to use dsr and epitools, respectively.

This work is licensed under a Creative Commons Attribution 4.0 International License.

Pingback: Epi 101: Indirect Age Adjustment by Hand and in R – EpidemioLogical