Archives
One-Way ANOVA Analyses, by Hand and in R
Posted on March 17, 2019 1 Comment

A student asked for help with a statistical analysis the other night, and I was happy to help. However, he threw me a curveball when he told me he needed to conduct an ANOVA test using only summary data. That is, all he had was the table of results (from a publication) and not the […]
No, the Recent Danish Study on MMR and Autism Doesn’t Show That Autism Rates Are Lower in Denmark
Posted on March 10, 2019 5 Comments
A new study from Denmark shows that 1% of the children studied were diagnosed as autistic. Does that mean that the prevalence of autism in Denmark is lower than that of the United States (2.7%)? Nope. Not by a long shot.
A Quick Explanation on Why 95% Confidence Intervals Get Smaller (For Non-Epidemiologists)
Posted on November 24, 2018
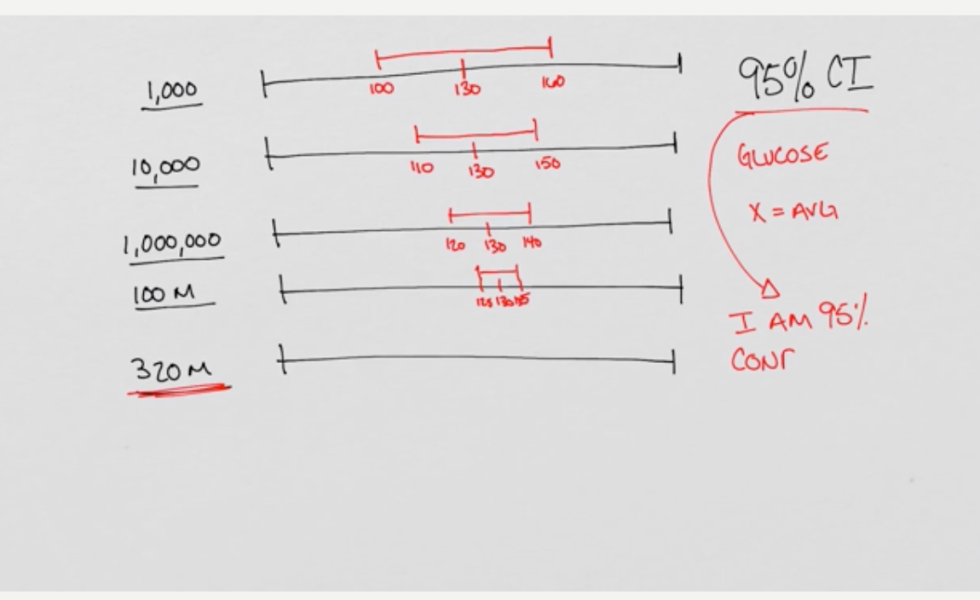
I’ve been tutoring some students in online MPH programs for a few weeks. We started talking about 95% confidence intervals. All you need to know when reading a confidence interval is that it is used for telling you (the reader) where we (the researcher) are 95% confident that the true measure is located. Here, let […]
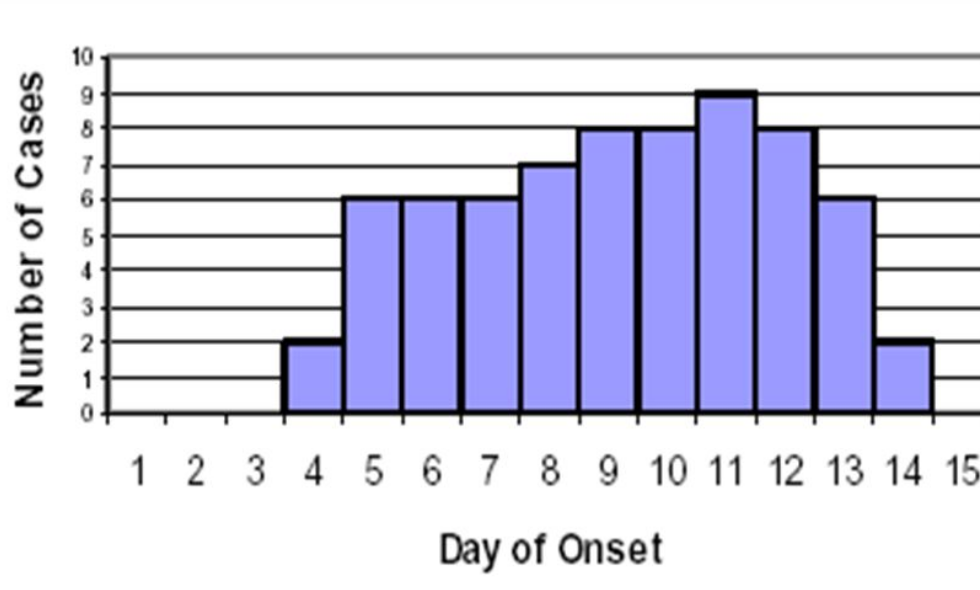
Epidemiology for Non-Epidemiologists?
Posted on November 22, 2018
Epidemiology is the basis for much of the work that goes into public health. From the research that gives us the evidence we need to conduct good public health policy, to the work that is done investigating outbreaks, we use epidemiology to help us understand what we are seeing. It’s a scientific branch (or a […]
Yes, There Can Be More Vaccinated People Than Unvaccinated in an Outbreak. Here’s Why.
Posted on September 28, 2018

When they tell you that vaccines don’t work, do some math.
A Web-Based Application to Visualize Homicides in Baltimore City Between 2005 and 2017
Posted on September 6, 2018
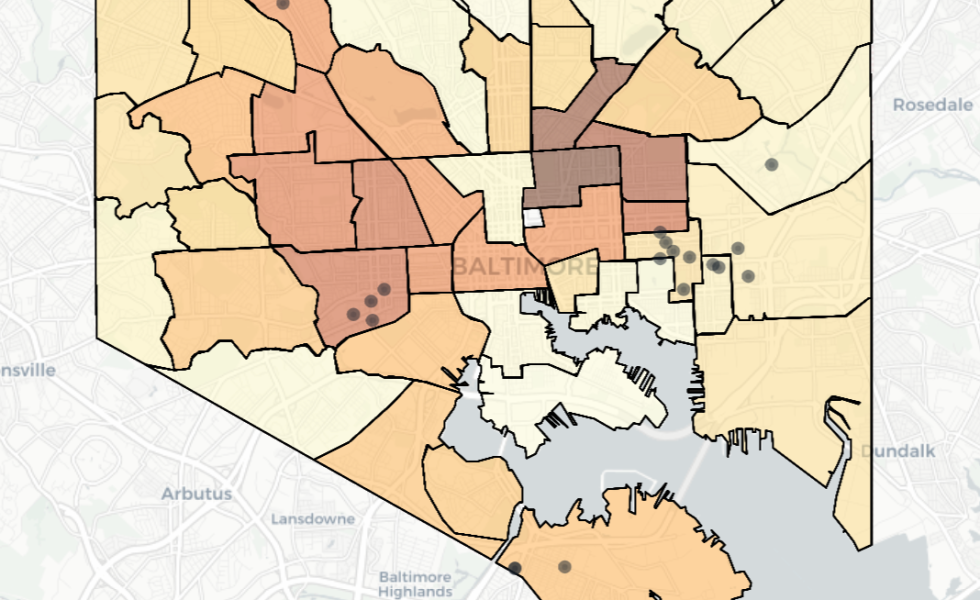
“How many African American women were killed by firearm in the Cherry Hill Community Statistical Area of Baltimore in 2016?” None. I was able to answer this question for you quickly because I have a dataset on homicides in Baltimore between 2005 and 2017. The dataset is the result of data from 2005 to 2016 […]
Which Is Better? A False Positive? A False Negative? A True Positive? Or a True Negative?
Posted on August 28, 2018
When dealing with screening tests that are susceptible to giving false positives and false negatives, you need to take into account a number of different things. Most importantly, you need to put your findings into context.
R Programming and the New Epidemiologists
Posted on August 11, 2018 3 Comments
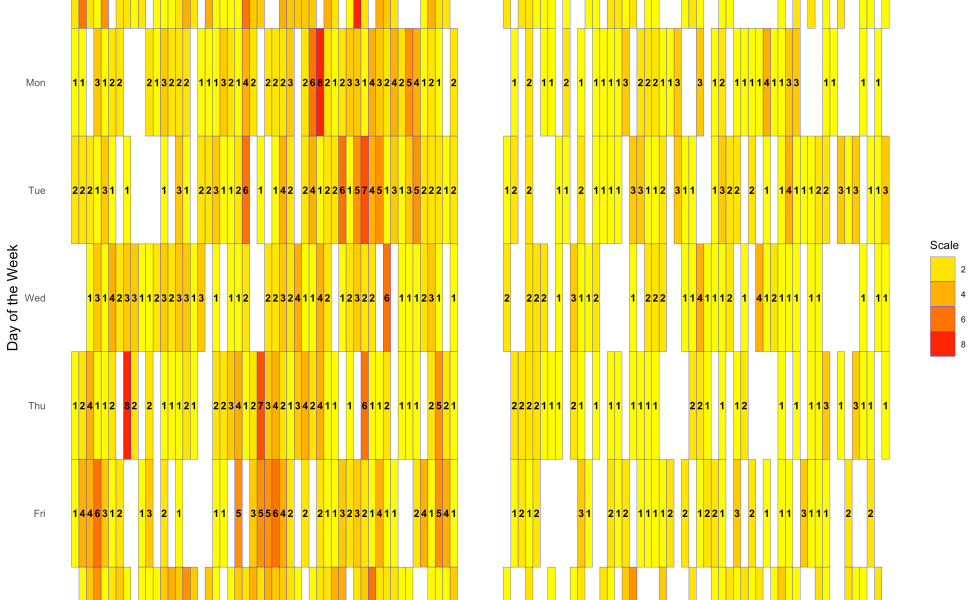
When I started working as an epidemiologist at a state health department, one of the most often used tools was the Microsoft Office Suite of programs. I used Excel for data analysis and visualization, Access to create and manage databases, Power Point to create presentations, and Word to create reports. Nevertheless, I’ve always been an […]
EpiRen’s Journal Club: Firearm-Related Hospitalization and Risk of Bad Stuff Thereafter, in Washington State, Between 2006 and 2011
Posted on May 9, 2018 2 Comments

This study is pretty interesting… Researchers in Washington State took hospital records from 2006 and 2007 and found all the firearm-related hospitalizations (FRH) through diagnosis codes. They then matched those cases with hospitalized patients who were not hospitalized for FRH. They used frequency matching, which is one of the various types of matching you do when conducting […]
What Would a Structured Public Health Practitioner Education Look Like?
Posted on March 22, 2018

In the United States, if you want to become a physician, there is a structured way of going about it. You go to college to get an undergrad degree, preferably in some science field. From there, you apply to medical school after taking the MCAT. Once you get into a medical school, you do four […]
