Archives
Black Boxes and the Cochran-Mantel-Haenszel Equation
Posted on January 1, 2020

When working with statistical software programs, you should do one or two calculations by hand just to make sure the software is working properly. The last thing you want is to have an error happen because you didn’t illuminate the inside of the black box.
Calculating TB Exposure Time Using R
Posted on November 29, 2019
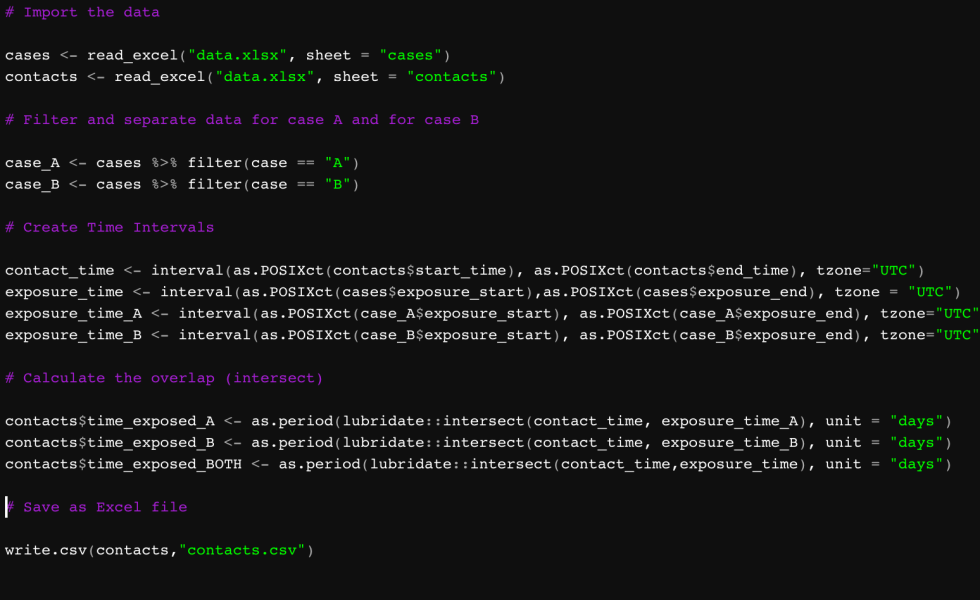
A quick explainer of how you can calculate exposure time between cases and contacts using R programming.
Odds Ratio or Marginal Effects? Depends on the Story You’re Trying to Tell.
Posted on November 19, 2019 1 Comment
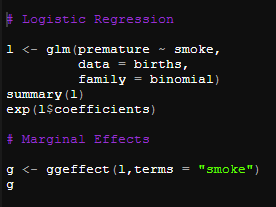
It’s been a while since I’ve written anything, so why not entertain you with a thrilling subject? Pop quiz: If you’re presenting the results of an analysis, do you present the odds ratio or the marginal effects? Let’s say you have 150 birth records, and you want to see if smoking is associated with premature […]
Preschool Exemptions to Vaccination in Connecticut
Posted on June 18, 2019

I have to work tomorrow, early, so this is going to be quick. I saw a news article about a couple from Connecticut who are suing in state court because the department of health is publishing information on vaccine exemptions. The health department data can be accessed here: https://portal.ct.gov/DPH/Immunizations/School-Survey If you look at those data, […]
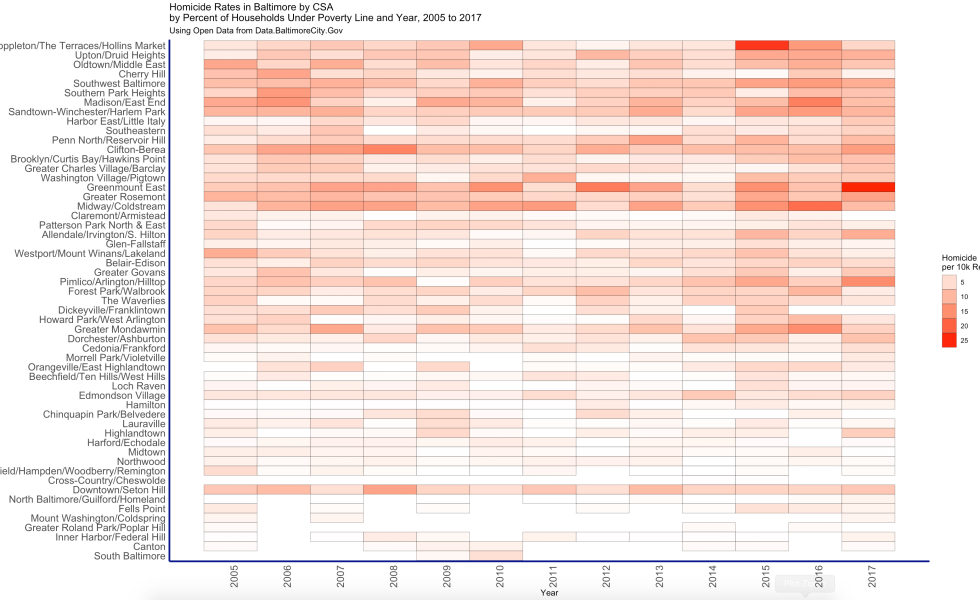
Analysis of Public Health Inequities Using R Programming
Posted on April 8, 2019
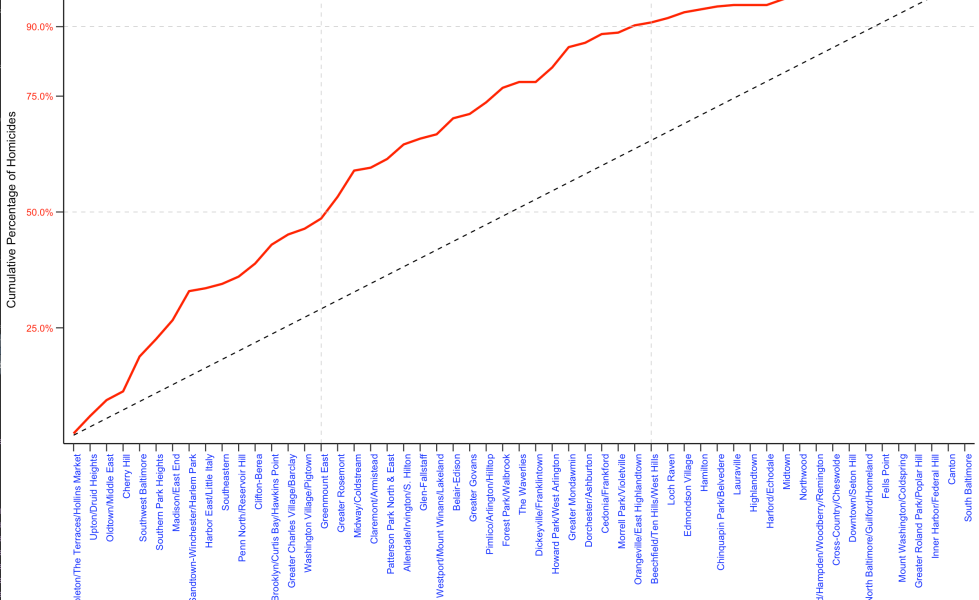
R programming can help with a lot of tasks. In this blog post, I show you how it can help understand and visualize inequities in Baltimore with regards to poverty and violence.
Seeing Data in Time and Space
Posted on March 13, 2019
How can you put three-dimensional data on two dimensions and still tell a story? Let me tell you how.
